Transport, housing, energy and fuel recorded the sharpest increases over the past four years.
Prices across several essential categories of goods and services have risen over the past four years, eating further into household budgets. With the sharpest annual increases now seen in transport, housing, energy and fuel, inflation remains firmly in the picture, steadily eroding households’ purchasing power.
Figures from the Cyprus Statistical Service show that the four years since 2023 have been marked by cost-of-living pressures extending well beyond the weekly grocery shop to important services.
Continuing price increases in education and dining out, alongside a steady rise in healthcare costs, show that pressure extends beyond goods to services.
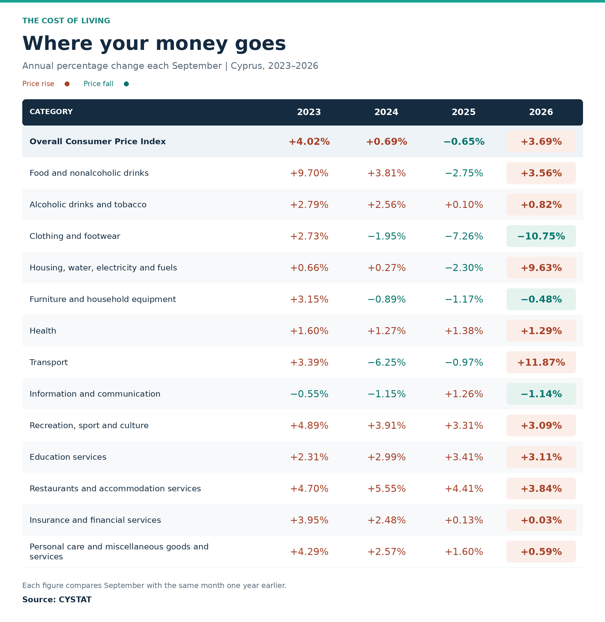
The overall Consumer Price Index showed prices rising at a relatively high annual rate of 4.02% in September 2023, before inflation slowed considerably to 0.69% in September 2024. In September 2025, the index fell by 0.65% compared with a year earlier. This September, however, inflation returned to a high level of 3.69%.
A concerning feature of the figures is that, apart from some price declines in clothing and footwear, furniture and household equipment, and information and communication, the remaining categories are moving upwards.
The central finding is that the easing of price pressures seen up to 2025 did not continue evenly into 2026. The rise in the overall index, together with sharp increases in essential spending categories, shows that the cost of living remains a significant concern for consumers.
Inflation returns
The overall Consumer Price Index recorded an annual increase of 4.02% in September 2023, slowing to 0.69% in September 2024. September 2025 brought a decline of 0.65%, before the index rose by 3.69% in September 2026 compared with the same month a year earlier.
These figures demonstrate the return of substantial inflationary pressure after a period of easing. But higher overall inflation does not mean that every category of goods and services followed the same path.
To track prices over the four-year period, we examine the annual percentage change recorded each September, from 2023 through to this year, across key categories of goods and services.
Where prices have risen — and fallen
Transport recorded the largest annual increase in 2026, at 11.87%, following declines of 0.97% in 2025 and 6.25% in 2024.
This sharp reversal points to a substantial rise in prices compared with September 2025. Transport costs are particularly important for households because they include spending on private vehicles, fuel and other transport services. Higher transport costs can also indirectly affect the cost of distributing products and bringing them to market.
Meanwhile, the category covering housing, water, electricity, gas and other fuels recorded an annual increase of 9.63% in September 2026, a marked change from the 2.30% decline recorded in 2025.
Higher spending on these essentials leaves less money available for other needs and can intensify financial pressure, particularly for lower-income households.
The figures also show renewed increases in food and nonalcoholic drink prices. This category rose sharply, by 9.70%, in September 2023, followed by a smaller increase of 3.81% in 2024. Prices fell by 2.75% in 2025, only to rise again by 3.56% this September.
The reversal suggests that pressure on food prices has returned, adding once again to the cost of everyday shopping. Groceries account for a substantial share of family spending, so increases can disproportionately affect households that devote much of their income to basic needs.
At the other end of the scale, clothing and footwear recorded the largest annual decline.
The annual rate for this category moved steadily downwards, from an increase of 2.73% in September 2023 to declines of 1.95% in 2024, 7.26% in 2025 and 10.75% in 2026. This September’s figure was the largest annual decrease among the categories examined.
Services are getting more expensive, too
Education services recorded annual increases of 2.31% in 2023, 2.99% in 2024, 3.41% in 2025 and 3.11% in 2026. Although the rate eased slightly in the latest year, prices continued to rise.
Restaurants and accommodation services recorded increases of 4.70%, 5.55%, 4.41% and 3.84%, respectively.
Both categories show a slowdown in inflation after 2024 or 2025, but neither returned to annual price declines. In other words, these services are still becoming more expensive, just at a slower pace than in some previous years.
Healthcare showed a notably steady pattern, with annual increases of 1.60% in 2023, 1.27% in 2024, 1.38% in 2025 and 1.29% in 2026.
The changes remained within a relatively narrow range, suggesting no sharp swings in the category’s overall index. Nevertheless, steadily rising prices can gradually add to household expenses, particularly for people who frequently need medical care. The overall figures do not mean that every healthcare service or medicine increased in price at the same rate.
The category covering personal care, social protection and miscellaneous goods and services showed a continuous slowdown in annual inflation, from 4.29% in 2023 to 2.57% in 2024, 1.60% in 2025 and 0.59% in 2026.
Similarly, the annual increase in insurance and financial services slowed from 3.95% in 2023 to just 0.03% in 2026.
Prices in these categories are now rising much more slowly. But slower inflation does not necessarily mean falling prices or a reduction in the overall costs consumers face.
The remaining categories present a mixed picture over the four years. Alcoholic drinks and tobacco recorded a relatively modest increase of 0.82% in 2026, while furniture, household equipment and routine home maintenance fell by 0.48%.
Information and communication prices also declined, by 1.14%, while recreation, sport and culture rose by 3.09%.
The figures show that inflationary pressure is not spread evenly across the economy. Some categories continue to become more expensive, others are relatively stable, and some are recording price declines.
What is clear is that the rise in the overall Consumer Price Index, alongside substantial increases in essential goods and services, means the cost of living remains a major challenge.
Despite periods of easing in some categories, renewed increases in transport, housing, electricity and fuel are placing a considerable burden on family budgets.
At the same time, higher prices for everyday necessities leave households with less room to spend elsewhere, making it increasingly difficult to manage the money available.
Even when prices fall in certain categories, the overall pressure on living costs remains keenly felt.
Annual percentage change each September