Filenews 6 August 2025

The flames from the fire that broke out in the Malia area of mountainous Limassol on July 23 were spreading at wind speeds, as can be seen from the satellite images collected by the Cyprus Institute. Within ten minutes of the detection of a smoke spot, an anomaly of surface temperature — therefore fire — is detected at two different points, with a total area of 8 km². It is not excluded, of course, that it is only one fire, which spread to this area.
All this is recorded in a report by the Cyprus Institute, which was prepared on the basis of the pioneering research program for the detection of the fire. The Cyprus Institute is developing a new, prototype algorithm for the analysis of newly available high-resolution satellite data, for fire detection and monitoring purposes.
As explained by the president of the Cyprus Institute, Stavros Malas, who was a guest this morning on CyBC radio, the algorithm analyzes satellite data every 10 minutes and takes about 3 minutes to produce results, which are presented as follows:
For smoke indicators: The pixels cover an area of 1 km².
For high temperature (fire) indicators: The pixels cover an area of 4 km².
What was found from the processing data for the day of the fire is that:
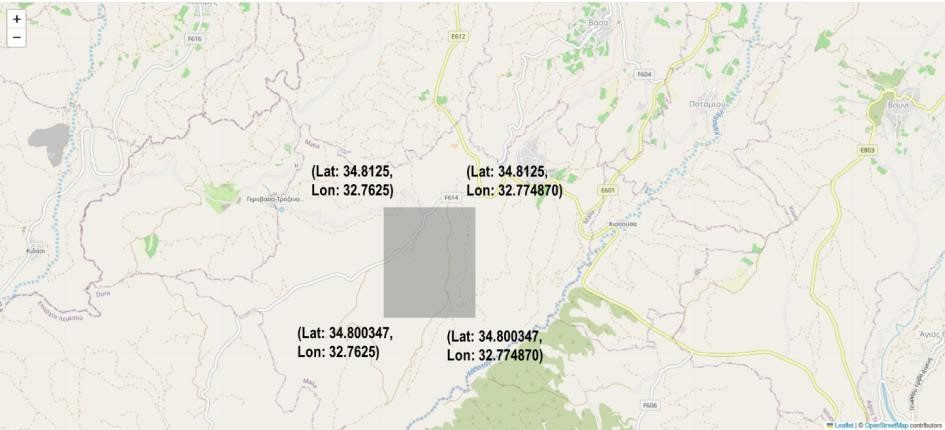
Between 13:22–13:32: Based on the smoke indicators, the algorithm sent a "smoke anomaly" notification to the area at 13:34, as illustrated in Figure 1.
Based on testimony, the existence of smoke had been established around 13:26.
Between 13:32–13:42: That is, during the next ten minutes, based on the satellite data processed by the program's supercomputer, the algorithm sent at 13:44 (the time that elapses until the data is processed) a second notification with two anomalies:
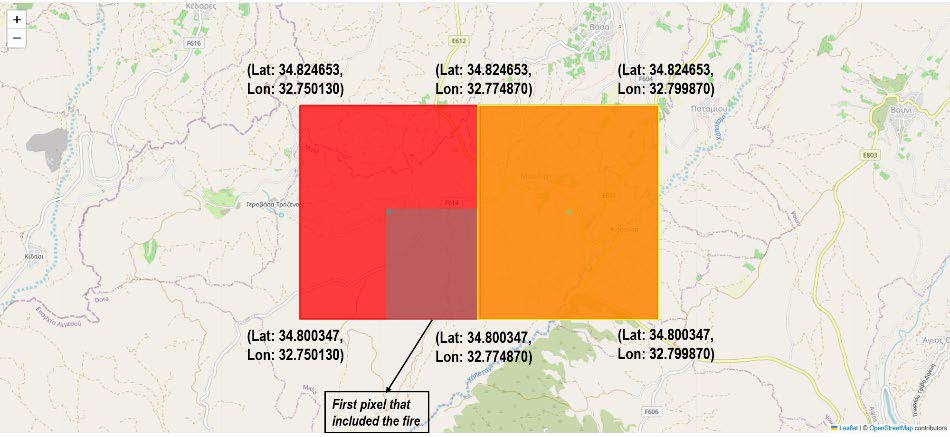
a. "Surface temperature anomaly": Two pixels were detected, each covering an area of 4 km², a total area of 8 km². They appear as red and orange rectangles in Figure 2.
b. "Smoke anomaly": Eight pixels were detected in the areas of the surface temperature anomaly, each covering 1 km² — four pixels in each area (red and orange).
Both anomalies are shown in Figure 2.
Figure 2: Pixel #1 (red, 4 km²) and Pixel #2 (orange, 4 km²) areas, totaling 8 km², where temperature and smoke anomalies were detected simultaneously between 13:32 and 13:42.
Within the Pixel #1 area (red), you can also see the smaller area where smoke was detected between 13:22–13:32.
According to the interpretation of the algorithm results, the red and orange areas (pixels) could correspond to one of the following two scenarios:
A fire starts on Pixel 1 (red) and spreads very quickly on Pixel 2 (orange).
Two different fires: one starts on Pixel 1 (13:22–13:32) and one on Pixel 2 (13:32–13:42), 10 minutes apart.
As noted in the report, no safe conclusion can be drawn for either scenario because satellite data does not provide images with better spatial resolution than described above. Smoke and temperature anomalies can be anywhere within the area covered by a pixel.
These preliminary data are based on a system that is in a pilot/pilot phase and is being developed in the context of a CARE-C doctoral thesis at the Cyprus Institute, funded by the European Commission through the H.E. Edu4ClimAte (Grant Agreement 101071247) project.
Tomorrow, a meeting between the Cyprus Institute and the Fire Brigade has been arranged, during which the Institute essentially puts the data it collects at the service of the state authorities. At the same time, it will send a notification to the General Coordination Center when smoke or fire is detected from the data it processes. It is an important tool, as it collects data from a satellite in near real-time, providing information for timely intervention.